

Litecoin, a peer-to-peer cryptocurrency, that is also considered the next Bitcoin killer, is, now trading at a price of $84.81, recently down by 0.36% from yesterday.
LTC, created in 2009 by Charlie Lee, started trading from $4.1, giving a total rise of 1872.84%. After Bitcoin, it was the first token to gained popularity because its creation was based on Bitcoin protocol but differs in using a hashing algorithm and its max supply.
It uses a Scrypt to mine, which consumes lots of memory, miners can mine a Litecoin by using regular computer hardware like GPU. The number of coins minded is 84 million, which is four times more than the supply of BTC.
Litecoin Price Prediction
Considering the BTC market, LTC is trading under the trading line, usually making small gains. In November 2021, LTC made a deep correction due to selling pressure, however, after that, we witnessed three major drops, which we can connect to the declining line. The immediate resistance of this token is at $100, but yet the token is unable to grow above it.
While relating it to BTC, if it made a correction, the same trend is expected by the LTC. The buying zone of this token is around $ 80, which can result in a great opportunity for investors.
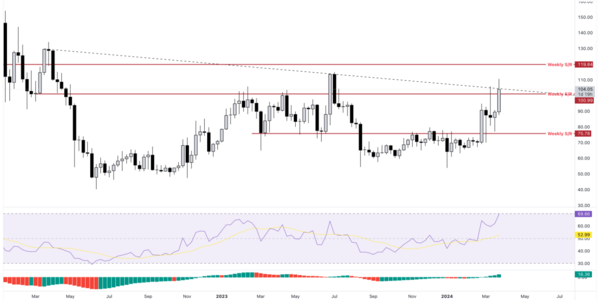
Source: TradingView
The short-term bearish can result in a big bull, for this inverters need to observe the trend of BTC price. If the price of BTC declines, LTC can also go down to a support of $75, making a correction of almost 8%.
According to the current market scenario, the price of LTC can rise to 2.46% by the end of May. While considering the technical indicators and market sentiments, it indicates a bullish trend for this coin as the Fear and Greed index reflects 76, which is a good sign.
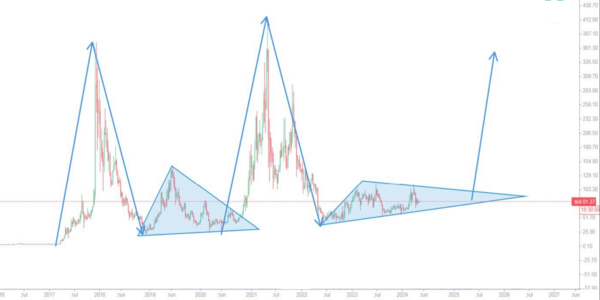
According to the chart, the price of LTC can spike above $150 by the end of 2024 and may touch the figure of $200 in early 2025.
Technical Analysis
Like other digital currencies, LTC also experiences price volatility, Traders can gain profit by purchasing in a dump and selling it when the price spikes.
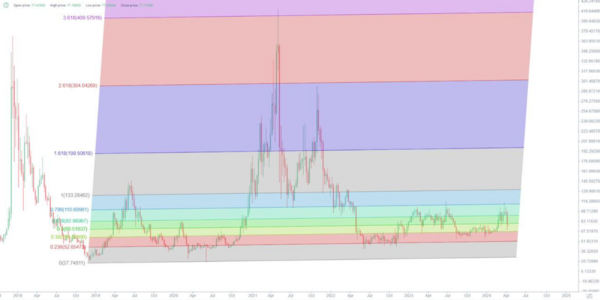
When doing a long-term technical analysis of Litecoin, look at its price movement over the past years. The chart shows that Litecoin mostly moves sideways within a wide range. It’s useful to apply the Fibonacci indicator to long-term charts. This helps you find important support and resistance levels.

While reviewing a chart for the short term, it is important to find out general trends and predict the direction of price for the upcoming time. While reviewing it, the trends are indicating a deep correction before its price goes high.
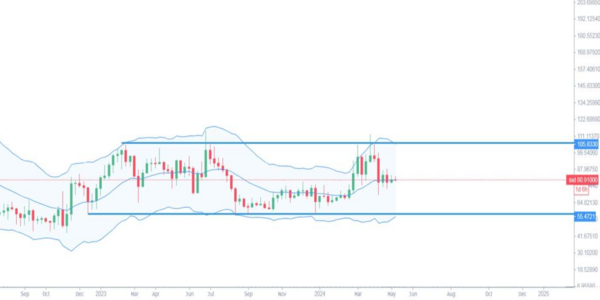
Now analyzing LTC between a price of $55 to $105 over last year’s trade. As a rule, when BTC spiked to its all-time high, LTC did not respond to it and when the BTC dropped to $57,000, LTC did not respond much. This means that the buyers are losing confidence in the token and don’t have enough courage to keep it above $105.
At the time of writing, Litecoin is trading at $84.81 with a trading volume of $319 million and a market cap of $6.3 billion.
Disclaimer: Please note that information provided is not financial advice. Do not invest on this behalf, do your best research before investing in crypto as you can risk your asset.