

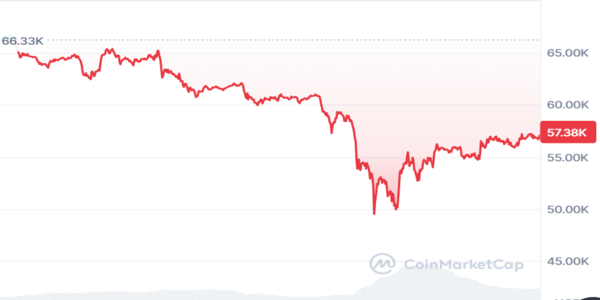
Bitcoin price has seen a blood bath during Ghost Month since 2017, and this year hasn‘t changed anything. Bitcoin made a great comeback by recovering 13% in its price after dropping its price to $49,050, but during this ghost month, investors need to remain cautioned especially in the Asian market.
According to this Chinese lunar calendar, ghost month appears from Aug. 4 to Sep. 2. It is technically the seventh month of the year, or August, and ends in early September. According to Chinese people, this month brings bad luck, and while considering Bitcoin, the price declines during this phase of trade.
It’s important to understand that this cultural phenomenon doesn’t directly impact stock or crypto markets. However, the start of Ghost Month often impacts market psychology and investors’ profit expectations.
However, Bitcoin price relates to this month as since 2017, the asset has seen a sharp decline during this phase of the year.
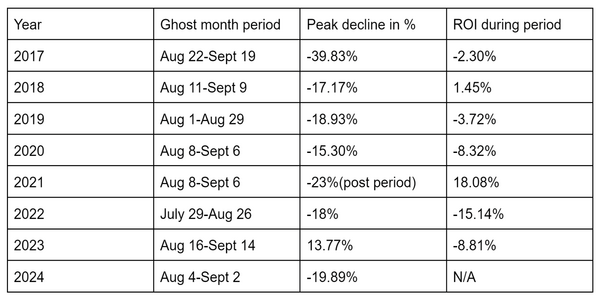
Although the overall ROI during this period is not always bearish, however, most of the time it impacts the investor’s profits. The year 2021, is the exceptional phase when the asset is traded against its traditional negative trend but witnessed a blood bath immediately after the ghost month.
In July the Open Intrest of the assed sees a significant drop from $21 billion on July 29 to $15 billion on August 6, warning the investors to be cautioned from liquidation.
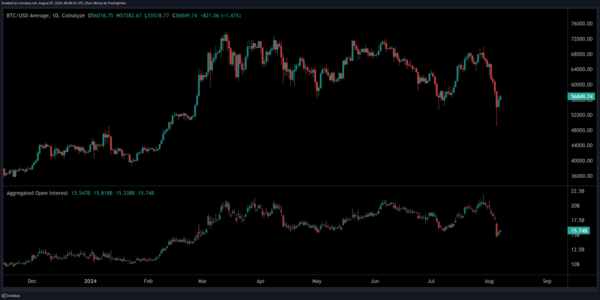
The August 5, of this ghost month sees a significant amount of coins being sold on lose. From one day to one week, BTC sees almost $5.2 billion of assets moved in just an hour.
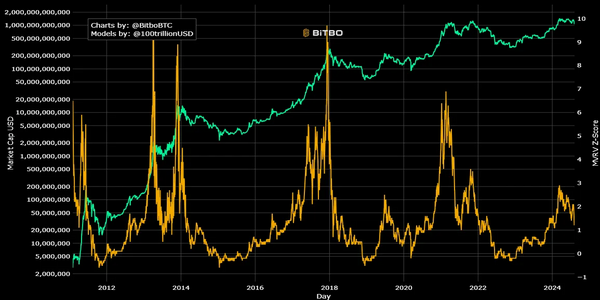
Key Pattern Highlighted by Bitcoin MVRV-Z Score
Bitcoin’s recent drop below $50,000 was due to various issues, like worries about a slump and possible changes in Fed policy. However, the MVRV-Z score suggests that the most exciting phase of this bull market is about to happen.
MVRV is calculated by dividing the asset’s market value by the realized value which gives the perspective of the demand and supply. If the ratio comes out above 3.7, it means the asset is overvalued, however, the index below 1 indicates the undervaluation of the asset.
In the past few years, the BTC indicates a ratio of 3.7 before every bull run. This happened in the years 2013, 2017, and 2021, but in 2024 the ratio still holds at 1.4 which is a clear indication of the bull run which has yet to start.
The price of BTC tends to be green after crossing a mark of $57K and is 4.36% positive in the last 24 hours of trade. The RSI also indicates an oversold scenario in one-day trade which suggests a bullish trend shortly.