

Bitcoin price movement appears to be very slow after the price decline, which occurred on June 7, making it just 6% away from a historical low.
Over the past 15 days, the movement of the Bitcoin price has remained very low, followed by a sharp decline on June 7 and appearing to be a historical low in the 15-day timeframe.
The period of Bitcoin trading between May 24 and June 7 was recorded as just 6% away from its all-time low for volatility, as said by Swan Bitcoin chief investment officer Rapha Zagury.
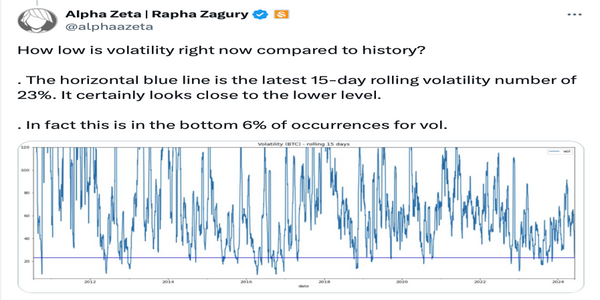
“The horizontal blue line is the latest 15-day rolling volatility number of 23%. It certainly looks close to the lower level,” Zagury stated in a June 7 post on X, pointing to the longest period in which bitcoin prices “stuck in a range.”
Data taken from CoinMarketCap reflects the Bitcoin movement within the 7% range, trading between %66,936 and 71,656, during which the Bitcoin price declined by 3.33% to $69,264.
The drop happened after the U.S. Employment Report showed stronger job growth than expected. This suggests that the Federal Reserve might not cut inflation rates on June 11, which analysts have been watching closely to predict Bitcoin prices.
Zagury pointed out what happened to Bitcoin’s price during past times of low or even lower volatility. In the next 30 days, the average return was 20.95%. The minimum return dropped by 32.06%, and the maximum return was 218.40%.
While looking at a yearly graph of similar low volatility periods, the results are even more interesting. The minimum return for the short term stood at 55.59%, with an average return of 820.82%.
The thoughts shared by Zagury are not any future indication, he just bbelieves there is “value in learning from the past.”
At the time of writing, Bitcoin is trading at $$69,314 with a 0.31% low in 24 hours.