

According to the Bitcoin price model, BTC may fall below $64,000 before moving on to its parabolic phase in the current bull run.
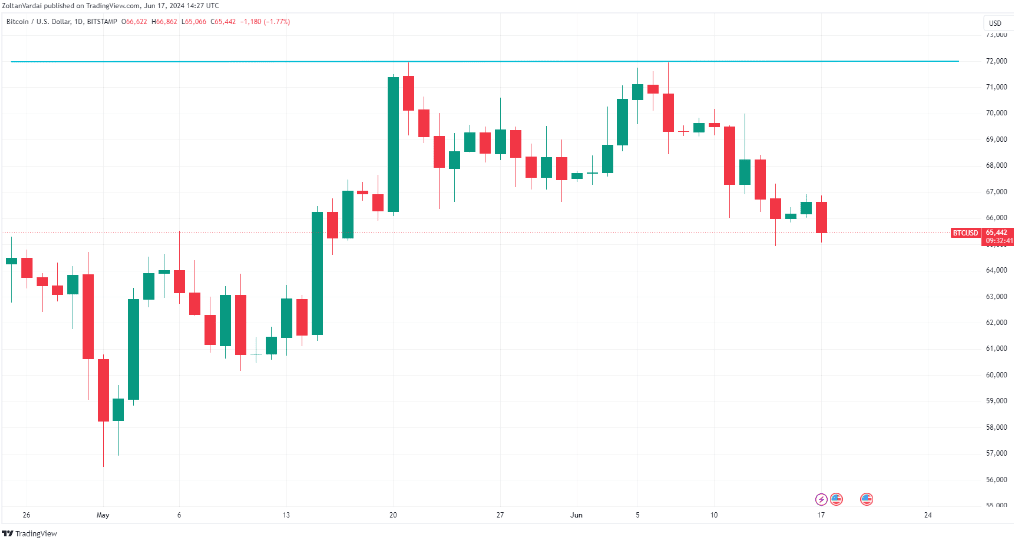
Based on the analysis of price clusters above $71,600, Bitcoin’s recent drop to $65,745 indicates a potential for further correction; the question remains: where will Bitcoin bottom before the parabolic phase commence?
Bitcoin Price Clusters Above $71. 6K Suggest Likely Correction Soon
Bitcoin’s price oscillations around key levels, such as $71.6k, may portend further downturn, according to Rekt Capital.
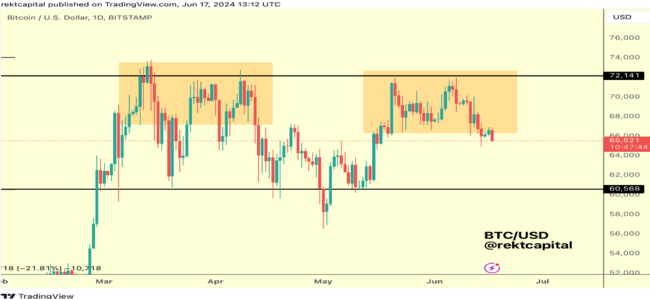
Bitcoin rose to $71,949 on June 7 and then dropped to $65,393, thus a 5. 7% weekly depreciation based on Bitstamp data.
Does the Bitcoin Price Need to Drop Below $64K Before the Rally Continues?
Crypto analyst Rekt Capital said that Bitcoin might have to go below $64000 in order to go through a correctives phase and enter the parabolic phase of the bull market.
However, popular trader Titan of Crypto posted on June 16th that the technical formation on the monthly chart could signal that Bitcoin may fall below $60000.
Bitcoin’s Relative Strength Index (RSI) shows that it may require further correction before it can continue the upward movement.
Bitcoin had an RSI of 41 on June 17, still being in the fair value trading range, unlike the low of 33 on May 1, where Bitcoin fell to $5600 before the bullish run began.
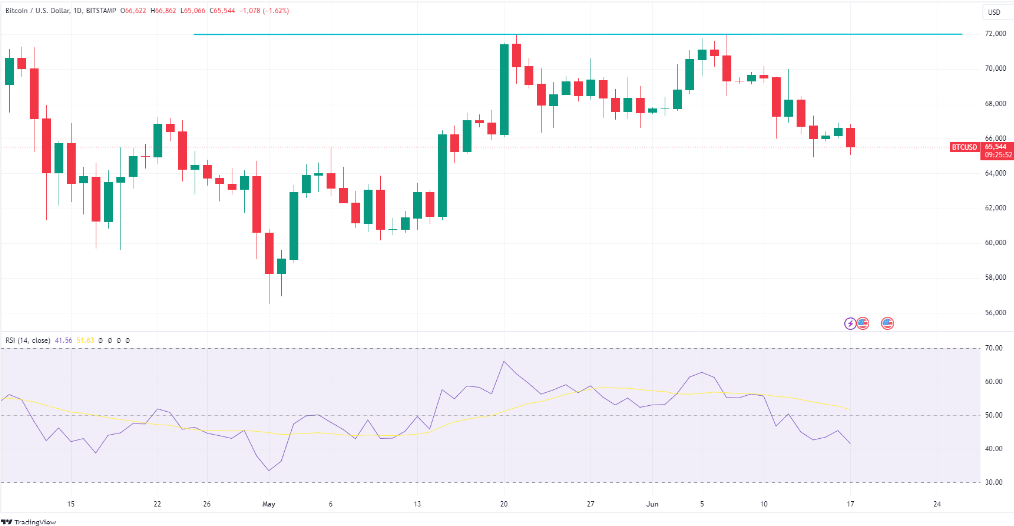
RSI is a popular momentum indicator that measures the level of overbought or oversold an asset based on its price fluctuations in recent periods.
The latest data from Coinglass shows that Bitcoin liquidation levels are showing good support at $64,500, and a break below this level risks over $520 million of leveraged long traders.
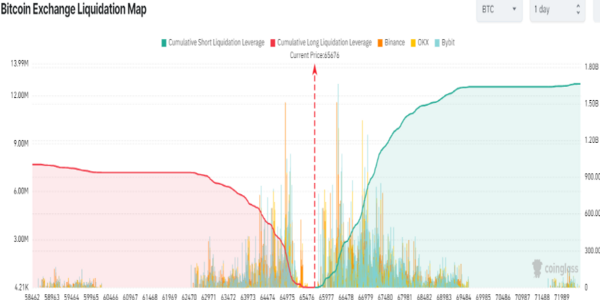
Nonetheless, shorter-term holders of Bitcoin imply the currency could find support above the $62,200 level.
As STH contains the most speculative part of Bitcoin holders, the price at which this group realizes its Bitcoins could point to the next support level for BTC.